The operating margins at Oregon hospitals continued their upward spiral following an analysis of second quarter financial reports obtained by The Lund Report. Operating margins include not only patient care, but also the profit margins from the hospital cafeteria, their gift shop, snack bar and medical and pharmacy supplies.
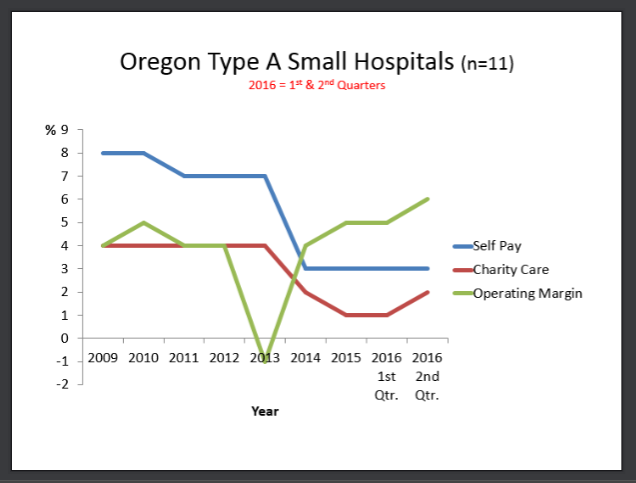
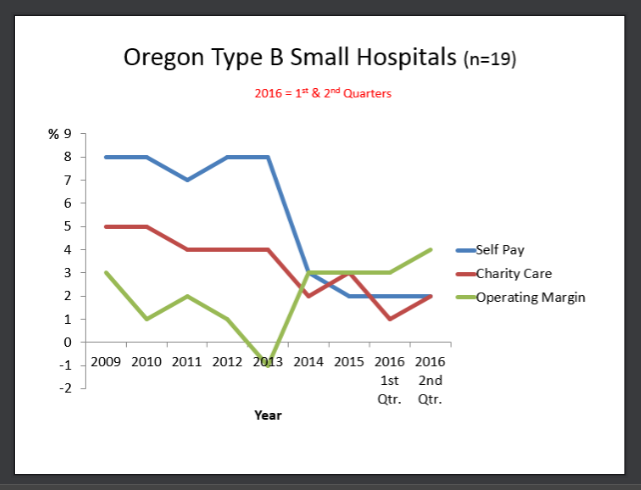
Even rural hospitals – those with under 50 beds that receive fee-for-service payments – performed extremely well. Their financial gains occurred at the same time as charity care dropped to its lowest level since 2010 – 1 percent, which represented 32 hospitals known as Type A and B because of their remote location. Typically, the majority of patients seen at these hospitals are on Medicare or Medicaid.
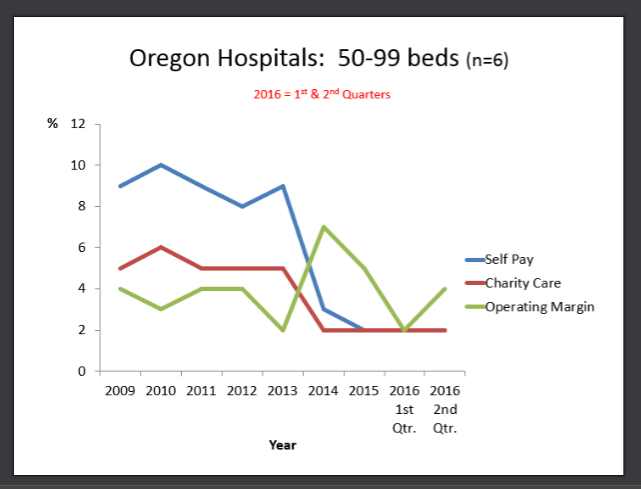
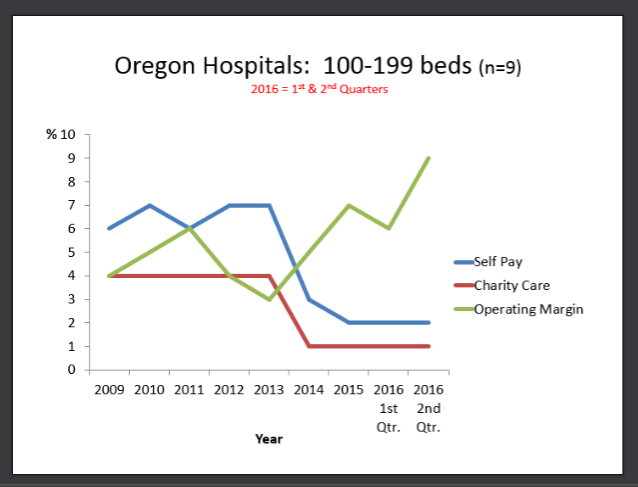
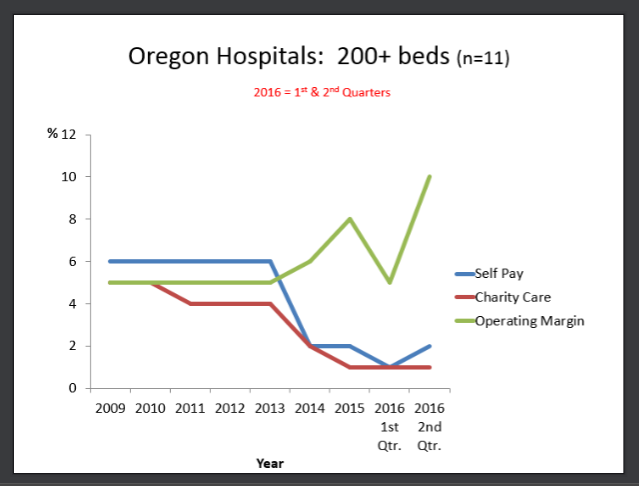
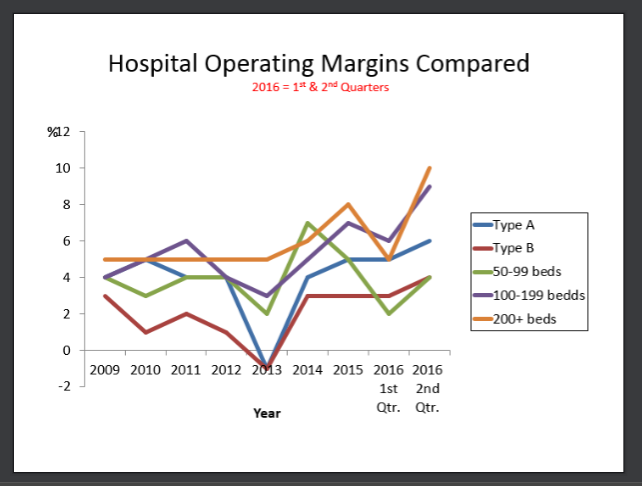
How did the larger hospitals in Oregon fare during the second quarter? Their operating margins ranged from 4 to 10 percent, depending on the number of beds. At the same time, charity care percentages dipped down to 1-2 percent for all hospitals in the state regardless of their bed size.
Hospitals also performed well when it came to their total margin. As of June 30, those percentages stood at 7 percent for those having more than 100 beds. Their smaller counterparts, hospitals with 50-99 beds, had a total margin of 2 percent, while the rural hospitals saw their margins range from 4-6 percent.
Lawmakers have started taking notice of these latest financial trends. Following the last recession, hospitals have done quite well, and it’s time, according to Rep. Rob Nosse, D-Portland, for the Legislature to start examining this pattern.
“There’s going to be a robust discussion in the Legislature,” he told an Oregon Health Forum audience this morning. “We’ll be looking at how hospitals can justify their nonprofit status and the high salaries of their executives.”
Patient Care
Hospitals considered Type A because of their remote location saw their inpatient days drop slightly in the second quarter to an average of 908 while their emergency room visits and outpatient services held steady at 2,004 and 14,480 respectively.
Their counterparts, known as Type B hospitals, realized similar trends. Inpatient days stood at 984 on June 30, while emergency room visits totaled 3,321 and outpatient visits, 23,770.
Hospitals with 50-99 beds reported that inpatient days and emergency room visits went down during the second quarter, to 3,962 and 7,955 respectively, while outpatient visits reached their highest level since 2010 – 40,456. These hospitals had, on average, 27 employed physicians.
For larger hospitals, with 100-199 beds, their inpatient days reached 6,643, while 8,286 people relied on their emergency rooms for treatment. Among these hospitals, Medicare represented 47 percent of their patient revenue, with Medicaid at 21 percent. These percentages have remained consistent since 2010.
Once again, these hospitals saw a huge gain in outpatient visits, 63,734. Just six years earlier, in 2010, those numbers stood at 44,948. And, they had 36 employed physicians.
Both inpatient days and emergency room visits saw a decrease in the largest hospitals – more than 200 beds -- during the second quarter, with those numbers reaching 23,911 and 13,086 respectively. On the payment side, Medicare was their largest payer, 41 percent of patient revenue, with Medicaid coming in at 23 percent.
The largest hospitals once again realized their largest gains from outpatient visits which reached 126,742.
Graphs Tell the Picture
The graphs below indicate the shift in self-pay, charity care and operating margin for Oregon hospitals.
Windfall Profits
The windfall profits for the Oregon hospital industry are showing their effects in the individual health insurance market, with 2017 rates skyrocketing past 2016 levels as insurers seem unable to leverage reasonable rates from providers, and plan to pass a big hurt onto the 242,000 consumers who must purchase by themselves.
A 2015 national study from Northwestern University also showed that when hospitals buy out independent medical practices, costs for those services rise 13.7 percent.
Health Affairs Analysis
According to a recent study by Health Affairs, which analyzed the profitability of 100 nonprofit hospitals in 2013 based on Medicare cost reports, the factors influencing surpluses include a hospital's market power, whether the hospital's market has a dominant insurer, retail price markup, prestige, teaching status, the mix of uninsured and Medicare patients, and for-profit or not-for profit ownership.
In Oregon, only one hospital made this list – Providence St. Vincent Medical Center, which reported a patient surplus of $97.4 million, and a surplus per adjusted discharge of $976.7 million.
“Profits are going to be high when a hospital has a very dominant market share,” said Gerard Anderson, director of the Center for Hospital Finance and Management at the John Hopkins Bloomberg School of Public Health and study co-author. “The Federal Trade Commission needs to take a look at whether there is unfair competition.”
Diane can be reached at [email protected].