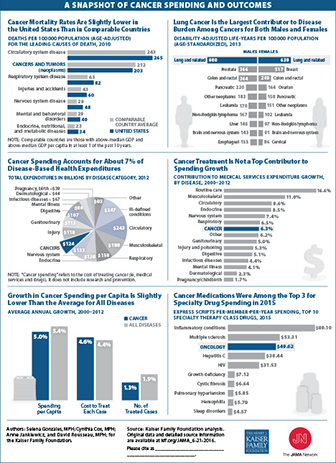
This Visualizing Health Policy infographic provides details on cancer spending and outcomes in the United States. The U.S. cancer mortality rate, 203 deaths per 100,000 population, was slightly lower than in comparable countries in 2010. Among cancers, lung cancer is the largest contributor to disease burden for both men and women. The United States spent $124 billion to treat cancer in 2012, which accounted for about 7% of the nation’s disease-based health expenditures. However, growth in cancer spending contributed slightly more than 6% to the nation’s medical services expenditure growth between 2000 and 2012, while the top 3 diseases contributed 36%. During that time, per capita spending on cancer increased 5%, which was slightly lower than the average for all diseases. Cancer medications were among the top three for specialty drug spending in 2015, behind medications for inflammatory conditions and multiple sclerosis.
Visualizing Health Policy is a monthly infographic series produced in partnership with the Journal of the American Medical Association (JAMA). The full-size infographic is freely available on JAMA's website and is published in the print edition of the journal.