Last month, a new COVID-19 variant from the omicron family spread across Oregon, causing a seventh wave of infections.
On paper, this seventh wave hasn’t looked particularly impressive, peaking in late May at about 1,500 new cases reported per day. But data from sewage samples collected at wastewater treatment plants across the state suggests that the BA2 omicron variant is silently causing far more infections than are showing up in state testing tallies.
“Wastewater across the state is more or less at record highs or near record highs,” said Tyler Radniecki, an associate professor of environmental engineering who is leading the wastewater sampling research effort at Oregon State University.
The OSU project is part of a nationwide COVID-19 wastewater surveillance effort. The viral concentrations in Oregon during the current surge look similar to what the team saw during the peaks of the delta surge last August and the first omicron surge in January.
By the end of May, the concentration of virus in wastewater samples registered as “strong,” indicating a significant outbreak, in much of the state. In a handful of communities, including Forest Grove and Bend, concentrations of the virus were even higher, signaling particularly intense BA2 outbreaks.
What the wastewater shows, Radniecki says, is that the state’s tally of COVID-19 cases is a very significant underestimate of the actual spread of BA2.
Wastewater monitoring does not, however, give any indication of how much severe illness a particular variant is causing. Hospitalization data shows BA2, like other omicron variants, is mostly causing milder cases, though the number of people with COVID-19 in intensive care rose above 50 this week.
Case counts have always been a very imperfect measure of actual infections because they are highly dependent on the number of people getting clinically tested for COVID-19. And as more people use rapid at-home tests, the amount of clinical testing is dropping, making case counts an even less reliable proxy for COVID-19 spread.
To better understand how prevalent the virus is, some local public health officials are increasingly relying on the wastewater data instead.
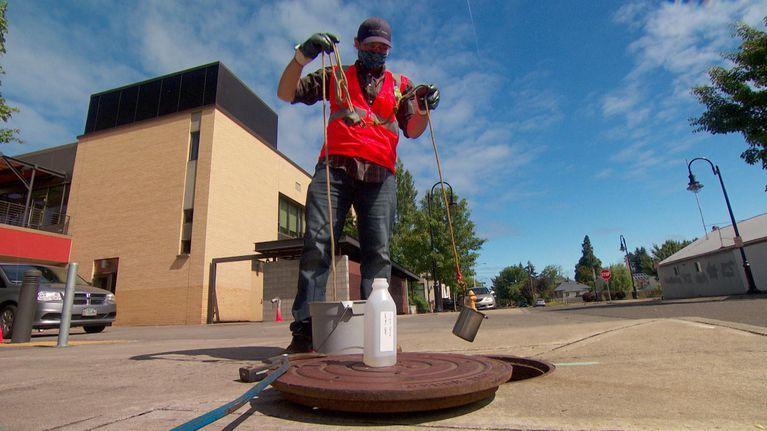
The surveillance method takes advantage of the fact that many people infected with COVID-19 shed the virus in their poop. The OSU team collects data from around 40 wastewater treatment plants statewide, from Ontario to Warm Springs to Florence.
Every week, the treatment plants use a small filter to collect a representative sample of the sewage flowing in over a 24-hour period. The filters get rolled up, stuck in little tubes, and shipped to Corvallis. OSU’s scientists identify viral RNA on the droplets in the filters and quantify it. After two years of honing the process, it now takes about 4 to 5 days from when a sample is collected to when OSU has an estimate of how much COVID-19 virus is in it.
The researchers also extract genomic sequences from the wastewater samples to look for variants of concern.
George Conway, Deschutes County’s health officer, says two things make wastewater monitoring powerful. First, everyone living upstream of the wastewater plant contributes to the sample.
“It’s a pooled source,” Conway said. “This helps us to better gauge the current rate of community infection.”
Second, people infected with COVID-19 start shedding the virus in their feces before they are symptomatic, and before they may choose to seek out testing. As the OSU team has streamlined its protocol, wastewater is coming closer to providing a real-time look at outbreaks as they develop.
“It has given us reliable early warning,” Conway said of the testing. “That can inform our communications to medically fragile persons and give time for medical providers and hospitals to better prepare for an increasing caseload.”
The wastewater testing data is available to the public. Radniecki encourages people to look at it, to understand if the virus is spreading or on the decline in their community.
“If you are seeing very large signals in your community, that might change your behaviors or the risk you’re willing to take,” he said
Right now, for example, the data shows COVID-19 concentrations leveling off or decreasing in most of the state, but rising in parts of southern Oregon.
It takes a little work to read the data. Each colored dot represents an individual community. Click on it, and it pulls up a chart showing how the concentration of the virus has changed in that community over time. The chart uses a logarithmic scale to show the concentrations of the virus. Similar to the way we measure the magnitude of earthquakes, it means a small increase in value at the top of the scale represents a big increase in the concentration of the virus present in a community’s wastewater.
Next month, Eugene and Springfield are hosting the World Athletics Championships, an international track and field competition and one of the world’s largest sporting events. The poop in those cities, Radniecki says, will be especially worth watching from July 15 to 24, when track athletes from around the world will be in town. It will be a good place to hunt for new COVID-19 variants, and a golden opportunity to study how a massive sporting event impacts public health.
This story was originally published by Oregon Public Broadcasting.