Since Open Enrollment began on November 1, more than 11.6 million Americans have taken the opportunity to get covered (2.7 million through State-based Marketplaces through December 26 and over 8.9 million through HealthCare.gov or CuidadodeSalud.gov through January 23). Only four days remain ahead of the final January 31 enrollment deadline for 2016 coverage.
Here’s a look at the progress HealthCare.gov states have made as of January 23:
Over 8.9 Million HealthCare.gov Plan Selections Nov 1 – Jan 23, 2016: Over 8.9 million people signed up for health coverage throughHealthCare.gov over 15% more compared to last year through the end of week 12.
Nearly all states have more plan selections in Week 12 of OE3 than Week 12 in OE2: Of the HealthCare.gov states, 35 have more plan selections in Week 12 of this year’s open enrollment (OE3) than they had in Week 12 of last year’s open enrollment (OE2). Fourteen states are more than 20% higher: Oregon, Nevada, Iowa, Utah, South Dakota, Louisiana, Nebraska, North Dakota, Tennessee, Oklahoma, Alabama, Maine, Wisconsin, and New Jersey.
Graph 1: Plan Selections in 2016 as a Share of 2015 Plan Selections by State
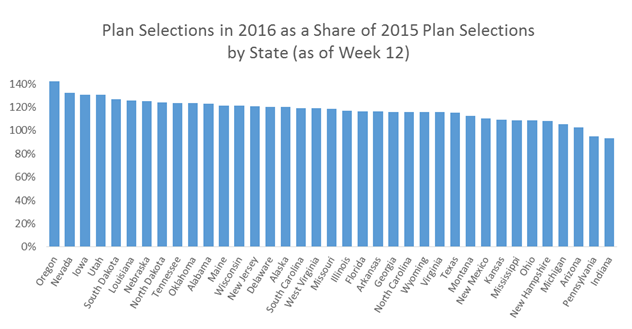
* Data as of January 23, 2016.
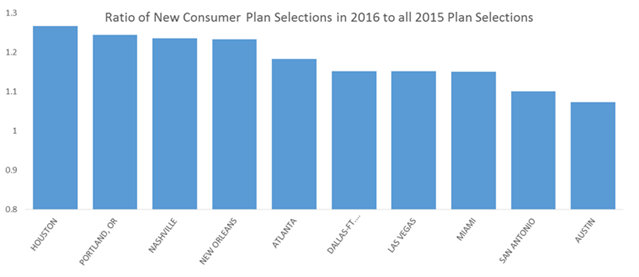
Several large Southern cities have seen disproportionate growth in new consumer plan selections in OE3 relative to their 2015 enrollment. Houston accounted for 3.2% of all 2015 consumers, but has 4.0% of new consumer plan selections for 2016, a 27% increase. Several other Texas media markets (also known as Designated Market Areas, or DMAs) have recently seen enrollment increases, including Dallas, San Antonio, and Austin. Other Southern DMAs with disproportionate growth include Nashville, New Orleans, Atlanta, and Miami. Outside of the south, Portland, OR has seen disproportionate growth. In 2015, Portland had 0.9% of consumers but has 1.2% of all new consumers in 2016 – a 26% increase year-over-year.
Graph 2: Ratio of New Consumer Plan Selections in 2016 to all 2015 Plan Selections in 10 Large Cities