
More people accessing help under Measure 110 but gaps in services, data remain

New dashboard shows how $36.6 million was spent under the drug decriminalization law
Image
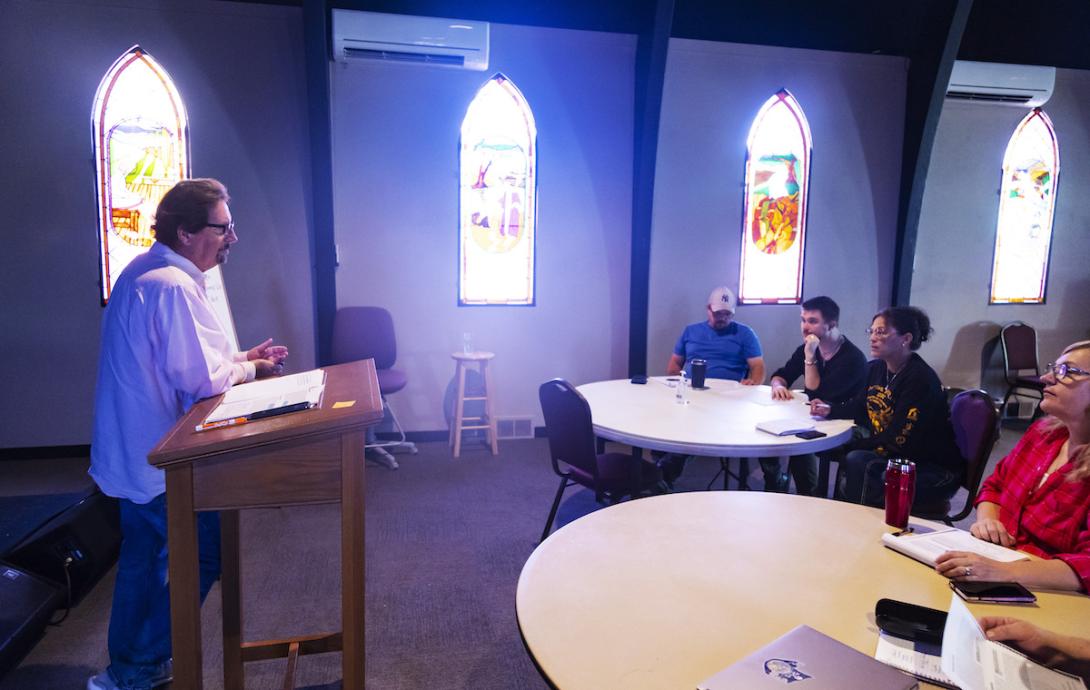
Ken Rush teaches a group of peer support mentors inside Origins Faith Community, a nonprofit in eastern Oregon that received funding through Measure 110 to start a peer support program and expand its services. | KYLE GREEN/THE LUND REPORT
June 28, 2023

The $265 million in grants the state awarded under Measure 110 last year are mostly being spent on housing and peer mentor-provided support services so far, according to a database unveiled Wednesday.

The interactive dashboard the Oregon Health Authority posted online shows, for the first time, how people in Oregon are using services funded through the state’s 2020 drug decriminalization law, as well as what the money is being spent on and the age and racial demographics of clients served.

The new dashboard shows that more people are engaging with harm reduction services, such as clean syringes and fentanyl testing strips to make drug use safer, than any other service funded through the measure.

Of the total awarded, about $36.6 million in funds were spent between July 1 and Dec. 31, 2022, according to the database.

The release of the detailed data — which is viewable at the statewide and county level in all categories — marks a new stage in the rocky rollout of Oregon’s voter-approved drug decriminalization law. However, the dashboard lacks some key data points that would help the public better gauge the measure’s success.

The data covers the second half of 2022, with housing services making up the largest line item of spending so far, at $12.5 million spent.

Image
SOURCE: OREGON HEALTH AUTHORITY'S MEASURE 110 DASHBOARD

A spokesperson for the health authority, Tim Heider, told The Lund Report that the new dashboard is “ able to provide comprehensive and transparent reporting very accessibly to anybody who wants to who wants to access them.”

The state, he said, will “continue to refine the information that we’re collecting.”

Like much of Measure 110’s implementation, overseeing the grant making process and tracking the data has proved challenging for the Oregon Health Authority, which was unable to accurately report on how an earlier round of grants were spent and faced repeated delays in getting money to treatment and recovery service providers. The agency was struggling with the COVID-19 pandemic and staffing shortages as the new law took effect in February 2021. 

Under Measure 110, a volunteer oversight council was tasked with selecting the grant winners that would comprise at least one Behavioral Health Resource Network in each of Oregon’s 36 counties. All told, there are now 42 of these networks and 233 organizations receiving Measure 110 funding.

Between the third and fourth quarter of last year — the number of people accessing services under Measure 110 increased in every category, according to the dashboard.

The number of people accessing low-barrier outpatient substance use disorder treatment grew 44% to 5,000 clients, and the number of people accessing housing grew 125%, with about 1,700 people receiving services in the fourth quarter of the year (shown as Q2 on the dashboard).

Members of the Oversight and Accountability Council tasked with implementing the measure were enthusiastic upon seeing the dashboard during their weekly meeting Wednesday afternoon. “No one should be able to tell us that this isn't working and we're not making a difference in Oregon," said council member Ron Williams.

By far, the greatest number of people received harm reduction and support services that peer mentors provided.

Image
SOURCE: OREGON HEALTH AUTHORITY'S MEASURE 110 DASHBOARD

At least 10,100 individuals received harm reduction services, which include obtaining supplies for safer drug use, such as fentanyl testing strips, clean syringes and overdose-reversing medication.

At least 7,600 individuals received services from peer mentors, which are people in recovery who are certified to serve as a mentor and connection to resources. Peer mentors connect with individuals in a variety of settings, from hospitals and jails to shelters and on the street.

The most frequently used services were peer mentors, followed by substance use disorder treatment and harm reduction.

Image
SOURCE: OREGON HEALTH AUTHORITY'S MEASURE 110 DASHBOARD

According to the data, a client interacting with a treatment program did so an average of 7 times, and those engaging with harm reduction did so an average of 2.6 times.

Among the dashboard’s weaknesses: It does not show how many unique individuals Measure 110 funds have served so far or how people are moving through the system. For example, it’s unknown how many uses of harm reduction services led to the person engaging with treatment. 

While the data displays a figure purporting to show the number of clients receiving each service category in each quarter, a health authority spokesperson confirmed that the same individual could be counted multiple times across categories and quarters.

The new dashboard also showed what providers reported to the agency about their successes and challenges. The most common challenge, which 38% of providers reported facing, was struggling to hire and retain staff. Interestingly, the successful hiring and retention of qualified staff was also near the top of the list of noted successes, with 32% noting that achievement.

“Shortly after finally receiving funds in early October we were able to hire all culturally and linguistically specific Latinx Measure 110 funded case manager/peer mentor staff and quickly launch services,” one unnamed provider reported.

Also topping the list of challenges was “difficulties understanding and fulfilling (Measure 110) program requirements.” Providers also pointed to shortages in housing and treatment resources as posing challenges, as well as difficulties engaging with specific communities.

At least one provider noted difficulty in separating peer services from harm reduction services when reporting their data to the state, as its peers deliver harm reduction, which is common.

Many questions still unanswered

The data was taken from reports grantees are required under statute to submit to the state. The second batch of those reports were due April 17, though more than 20% of the grantees failed to meet that deadline. There are four providers whose expenditure data was excluded from the dashboard because the state is still in the process of validating their numbers.

The health authority is still compiling information from tribes about their spending and will include that information in the dashboard later. Also absent is client data on LGBTQ+ status, which was collected but not yet included due to concerns around the sensitivity of the information in less populous, rural areas.

While a significant amount of the roughly $36.6 million that’s been spent so far has gone to capital, or construction, costs — about $15 million according to the dashboard — state health officials told The Lund Report they can’t say how much of that money went to establishing new housing units versus treatment centers versus any other services. Nor do they track the number of new detox or other beds, treatment slots or housing units that may have been created with that money.

“We are not … collecting data in that way from providers,” Kristen Donheffner, a Measure 110 program manager at Oregon Health Authority, told The Lund Report. “If a provider is funded for both a peer center and a house, they’re not necessarily reporting on what’s attributed to the peer center and what’s attributed to the house, they’re reporting housing, and they’re reporting peer services.”

Also not included in the data are client outcomes, such as how many clients have completed treatment or how many people who’ve been housed have remained in housing.

The health authority hopes to start seeing how successfully individuals are moving through treatment, housing and other services by early 2024, said Emily Perttu, a data researcher for the agency. But, she said “we don't have the ability to do that right now.”

She said that’s because many grantees are new and not yet set up to track those outcomes and because the state system for making those connections is in the middle of being overhauled.

“We’re really doing the best we can right now until we have that more robust system for looking at the program as a whole,” Perttu said.

Disparities in access remain but likely shrinking

The dashboard also shows the race and ethnicity breakdown for each service accessed — a goal that was written into the measure was to address racial disparities in treatment and services access and to serve the marginalized communities harmed most by the war on drugs.

“The data is showing us that more people are receiving Measure 110-funded services and supports,” the agency’s Behavioral Health Director Ebony Clarke said in a statement. “However, the preliminary data also shows we have a lot of work ahead in closing service gaps in communities of color and other historically marginalized communities if we are to meet our OHA goal of eliminating health disparities by 2030.” 

The data shows the racial breakdown of different services accessed are either close to proportionate to state demographics or more heavily weighted toward communities of color in most cases.

Image
SOURCE: OREGON HEALTH AUTHORITY'S MEASURE 110 DASHBOARD

“The latest data show promising signs that Measure 110 is increasing more equitable access to treatment and other services for people in communities of color, who have historically faced greater barriers to care and borne the weight of disproportionate incarceration,” Tim Heider, a health authority spokesperson, told The Lund Report. “However, it’s still too soon to draw conclusions based on the most recent numbers. State health officials will continue to pay close attention to these data to see if Measure 110 and the local Behavioral Health Resource Networks it funds can sustain these encouraging early results and reverse long-standing inequities.”

Providers noted persisting gaps in culturally appropriate services. 

One provider reported, “due to the continued lack of culturally and linguistically specific SUD treatment, detoxification, mental health/psychiatric treatment, recovery housing and other systemic or bureaucratic barriers we continue to find it difficult to refer people to those needed services.”

The Oregon Legislature recently made some changes to Measure 110 with the passage of House Bill 2513, which required the Oregon Health Authority to better support the program — addressing concerns The Lund Report raised and that state auditors later echoed. 

Heider said the health authority is improving its data reporting, but “The changes we're making to data collection over time were pre-planned and not in response to HB 2513.”

Grantees must submit their reports for the first quarter of 2023 in June and July, and health authority staff will update the dashboard quarterly, after the reports are validated.


 Emily Green can be reached at [email protected]. Follow her on Twitter @GreenWrites.

Comments